主要数据来源
Accelerating Sustainable Investment in Lampung: Advancing Strategic Commodity Downstreaming
Lampung Economic and Investment Forum 2026 (FOILA - Forum Investasi Lampung) · Rahmat Mirzani Djausal, Governor of Lampung · Jakarta, 2026-11-04 · 54 页
演示文稿中引用的数据来源包括 BPS、OJK、Bapenda楠榜、DPMPTSP楠榜、Disperindag、Dinas KPTPH、印度尼西亚劳工部和农业部。本网站每张图表均标注其所对应的 PDF 页码。
红色标注 估算
红色标注的数值未刊载于 FOILA 2026 官方来源。这些数值是为便于使用而补充的参考数据或推算值,正式使用前需予以确认。
| 数据表 | 项目 | 字段 | 原因 |
|---|---|---|---|
| region | * | bps_code | BPS region codes are reference data, not in the PDF |
| investment_project | KKI | region | Region (Lampung Selatan) inferred from ITERA location; not printed |
| investment_project | LSC | region | Region (Lampung Selatan) inferred from Kota Baru/ITERA location; not printed |
| investment_project | RAIL-PT | region | Region (Pesawaran, Tegineneng) is reference knowledge; not printed |
| investment_project | LBEZ | location_detail | 'Menggala area' inferred from the photo signage; not printed as text |
| energy_site | Ulubelu | region | Region (Tanggamus) is reference knowledge; not printed |
| commodity_stat | capture_fisheries/agri_potential_2026 | commodity | Label not printed on p10; identified as capture fisheries by matching p9 |
| downstreaming | * | * | PDF footnote: figures are estimates, not direct GRDP figures; row values do not add up to printed totals |
| map_layer | kabupaten | geometry | Regency boundaries from local dataset lampung-business-intelligence (BIG/BPS-derived, simplified); not in the FOILA PDF; reference only |
| map_layer | proyek/energi/wisata | coordinates | FOILA has no coordinates: points are estimated around the regency centre until official coordinates are provided |
| map_layer | simpul-transportasi/jalan-utama | * | OpenStreetMap / Overpass 2026-10-15 (© OpenStreetMap contributors), via local project superintelligence-lampung |
| map_layer | lintas-merak-bakauheni | geometry | Approximate ferry line curated in local project safetyindex-menpar |
来源中的已知问题
数值按原始刊载保留。存在未解决问题(如出口量)的数据不显示在仪表板中。问题说明以英文呈现。
| 页码 | 数据表 | 问题 |
|---|---|---|
| 12 | commodity_region_production | Corn East Lampung: bar chart 469.757 t vs map label 496.757 t. Stored 469.757. |
| 18 | commodity_region_production | Vannamei South Lampung: bar 14.631 t vs map 14.433 t. Stored 14.631. |
| 18 | commodity_region_production | Tulang Bawang & East Lampung bars equal Vannamei+Windu combined per map labels; bar title says Vannamei only. |
| 9 | commodity_stats | Coffee value printed IDR 654 M / USD 39.19 M on p9 vs IDR 6,69 T / USD 400 M on p10. |
| 52 | indicators | Corn production 1,26 million t on p52 (and 1,25 Mt on p9) vs 1.703.725 t on p10/p12. |
| 43 | projects | KAIL II land area 173,4 Ha (p43) vs Industrial Estate II Tanjung Bintang 171 Ha (p27). |
| 21 | downstreaming_2025 | Rubber: 7,4 of 9,3 (=80%) printed as 20%; Milk: 0,3+0,5 ≠ 0,2 and 0,3/0,2 ≠ 30%; Freshwater fish: 0,6+0,9 ≠ 2,5. Other rows consistent. |
| 21 | downstreaming_2025 | Row values do not add up to the printed TOTAL row: per-commodity downstreamed values sum to 122,5 T and unprocessed to 42,9 T (primary 165,8 T), while the TOTAL row and headline print Downstreamed 75,31 T (45,6%) / Unprocessed 89,99 T (54,4%). Headline figures are stored in `indicator`; row values stored as printed. Confirm with Bappeda before publishing the breakdown. |
| 42 | investment_project | Region for KKI and LSC (Lampung Selatan, near ITERA/Kota Baru), Prabumulih–Tegineneng railway (Pesawaran) and Ulubelu (Tanggamus) is reference knowledge, not printed in the PDF. |
| 21 | downstreaming_2025 | Footnote: figures are estimates based on production data, industrial capacity and commodity characteristics, not direct GRDP figures. |
| 23 | export_commodities | Export volumes/values look implausible as printed units (e.g. Robusta 16 million tons / USD 89 billion; Lampung coffee production is ~127 thousand t). Likely volumes in kg and values in IDR or cumulative multi-year. Stored as printed; verify with source (BPS/Disperindag) before publishing. |
| 39 | ump_lampung | Growth labels on UMP chart do not match computed growth (e.g. 2023: printed 7,32% vs computed 7,90%). Printed labels appear shifted. Use computed growth column. |
| 35 | nib_by_scale | NIB by business scale sums to 72.645 vs total 73.553 issued (Jan–Sep 2026). |
| 37 | cement_sales | 2023 retail+corsales = 1.063.867 vs printed total 1.063.868 (rounding). |
| 30 | indicators | Tourism growth printed 51,55% (p30) and 51,6% (p29) — same figure, different rounding. |
| 11 | commodity_opportunities | Printed 'Distthousandtion' corrected to 'Distribution'. |
| 10 | commodity_stats | Capture fisheries label not printed on p10 (icon only); identification inferred from p9. |
| 27 | project_features | Katibung estate zone areas (Ha) in the inset map are illegible in the source image; only zone names stored. |
| 8 | grdp_quarterly | Q1 and Q2 2026 GRDP (132,36 + 147,92 = 280,28) matches the H1 cumulative figure. |
| 51 | south_sumatra_agri_grdp | Sum of five provinces = 420,18 T vs printed total 420,26 T. |
下载数据
| 数据表 | 行数 | CSV | JSON |
|---|---|---|---|
| agri_grdp_southern_sumatra | 6 | csv | json |
| agri_machinery | 40 | csv | json |
| biochar_feedstock | 6 | csv | json |
| cement_sales | 4 | csv | json |
| commodity | 32 | csv | json |
| commodity_export_destination | 4 | csv | json |
| commodity_opportunity | 45 | csv | json |
| commodity_region_production | 44 | csv | json |
| commodity_stat | 48 | csv | json |
| company | 51 | csv | json |
| company_commodity | 53 | csv | json |
| connectivity_asset | 7 | csv | json |
| dam | 2 | csv | json |
| data_quality_issue | 20 | csv | json |
| document_section | 6 | csv | json |
| downstreaming | 18 | csv | json |
| energy_breakthrough | 3 | csv | json |
| energy_breakthrough_item | 6 | csv | json |
| energy_site | 16 | csv | json |
| export_commodity | 7 | csv | json |
| external_data_flag | 12 | csv | json |
| feed_supply_chain_step | 4 | csv | json |
| grdp_largest_sector | 6 | csv | json |
| grdp_quarterly | 2 | csv | json |
| grdp_structure | 3 | csv | json |
| hotel_length_of_stay | 10 | csv | json |
| indicator | 69 | csv | json |
| investment_project | 16 | csv | json |
| minimum_wage_lampung | 7 | csv | json |
| minimum_wage_province | 38 | csv | json |
| narrative | 13 | csv | json |
| nib_by_scale | 4 | csv | json |
| policy_commitment | 15 | csv | json |
| processing_industry | 16 | csv | json |
| project_feature | 28 | csv | json |
| province | 38 | csv | json |
| region | 15 | csv | json |
| source_document | 1 | csv | json |
| success_story | 9 | csv | json |
| sumatra_province_economy | 10 | csv | json |
| third_party_funds | 7 | csv | json |
| tourism_destination | 9 | csv | json |
| tourist_trips_annual | 6 | csv | json |
| tourist_trips_by_province | 11 | csv | json |
| travel_route | 8 | csv | json |
| vehicle_growth_trend | 4 | csv | json |
| vehicle_purchase | 15 | csv | json |
| vehicle_purchase_total | 3 | csv | json |
图片来源
照片来自 Wikimedia Commons(按其相应许可使用)、楠榜省政府官方网站以及为本网站提供的资料。点击照片标题可打开其原始来源。
- Maize field, Aduwan, Kafanchan, NigeriaKambai Akau · CC BY-SA 4.0
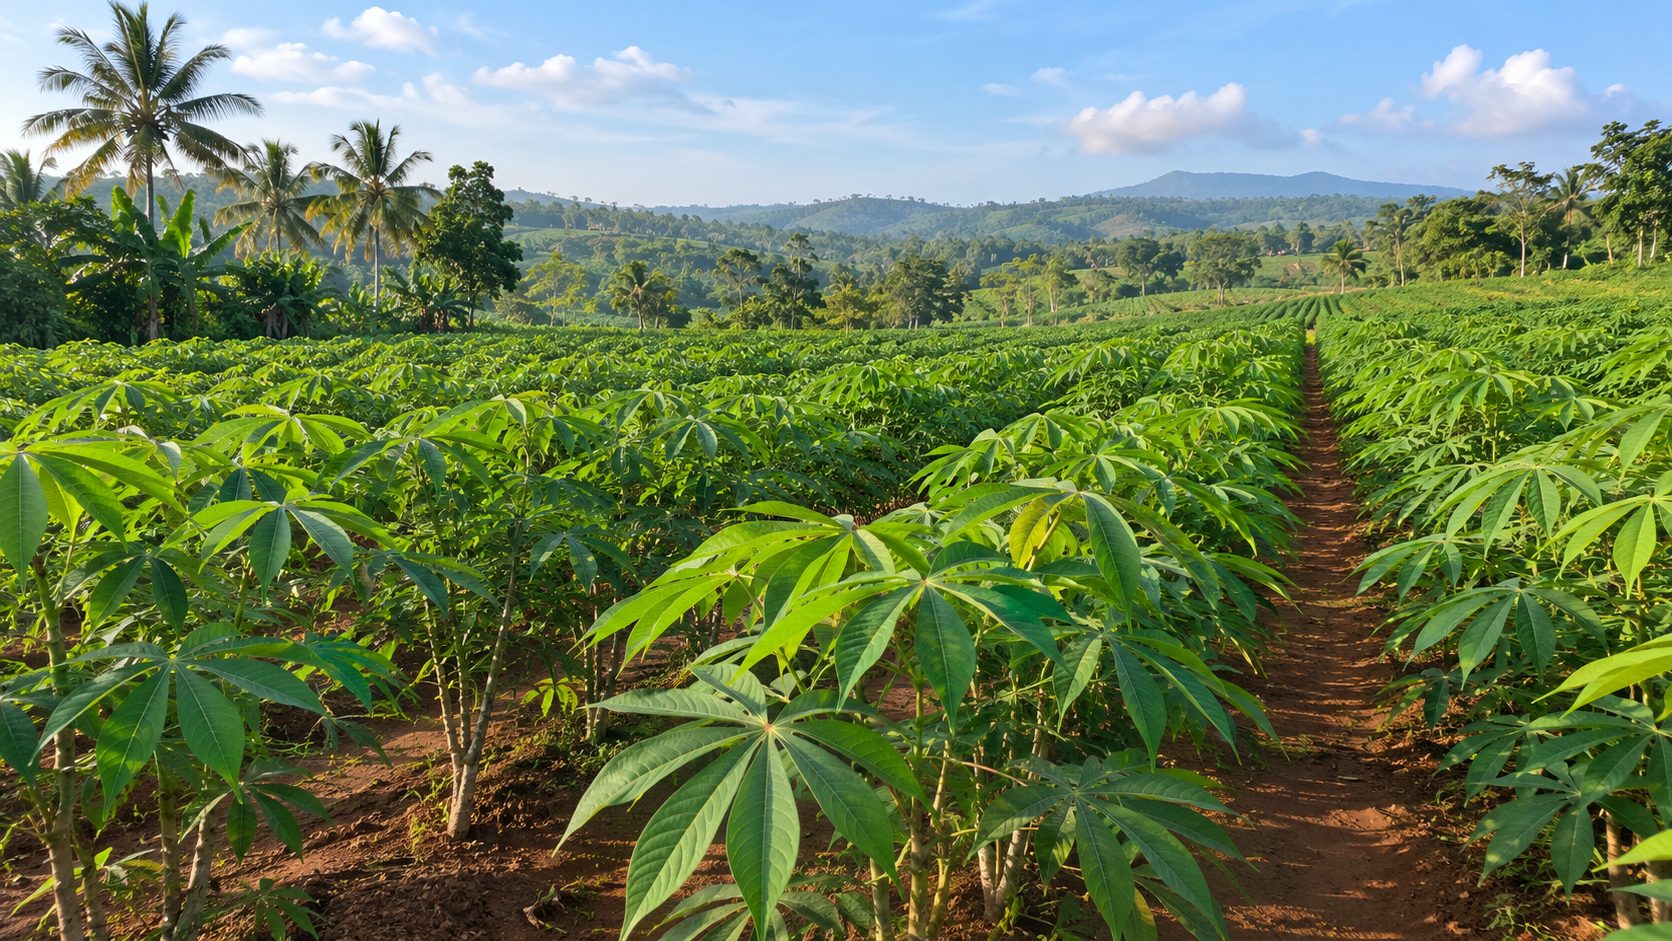
- Kebun singkongDokumentasi pengguna · 用户提供
- Coffee Plantation in Takengon, AcehUSAID Indonesia · 公有领域
- Tambak udang dan bandeng di JuwanaDnovianto · CC BY-SA 4.0
- Pahawang Island, IndonesiaFidelia Zheng · CC0
- Pelabuhan Bakauheni, LampungM. Reyza Rifaldi · CC BY 2.0
- Trans–Sumatra Toll Road under construction, BanyuasinFirzafp · CC BY-SA 4.0
- Kereta api barang angkutan kontainerAndra Radithya · CC BY-SA 4.0
- Lance's Right, MentawaiPathofkarma · CC BY-SA 4.0
- Rahmat Mirzani Djausal, Gubernur LampungDokumentasi pengguna · 用户提供
- Lampung Industrial Estate II (KAIL II)Pemerintah Provinsi Lampung · 官方来源
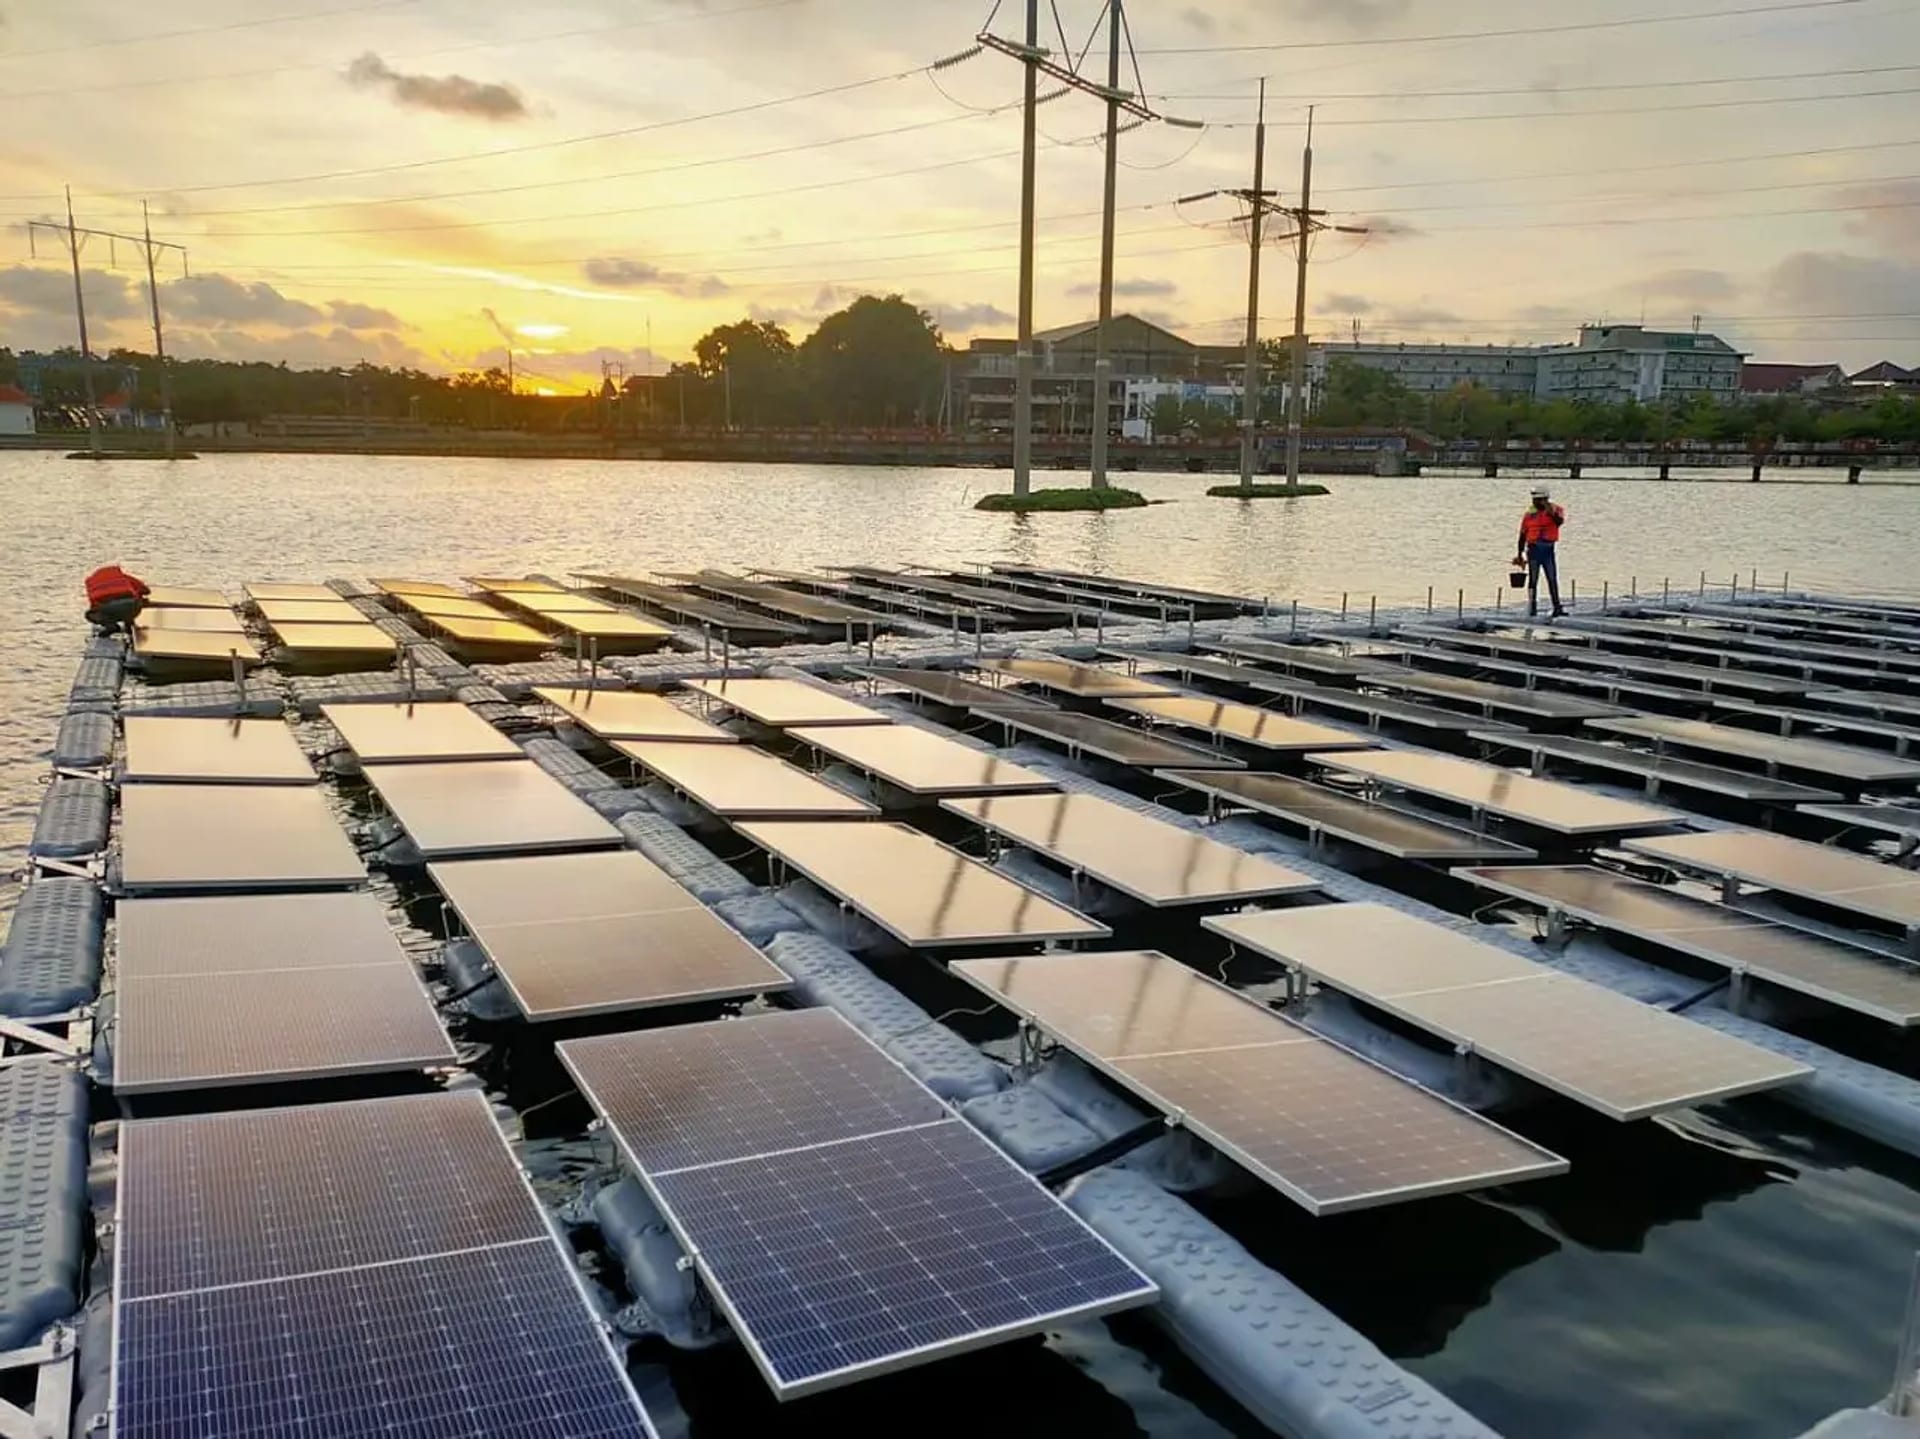
- PLTS Terapung Way JeparaPemerintah Provinsi Lampung · 官方来源
- PLTS Terapung, LampungDokumentasi pengguna · 用户提供
- Menara Siger, Bakauheni, LampungDokumentasi Bakauheni Harbour City · 用户提供
- Gajah Way Kambas, LampungIndonesia Tourism · 来源:indonesia-tourism.com
- Lari 5.000 meter, Rio Olympic GamesTim Hipps / U.S. Army · CC BY 2.0